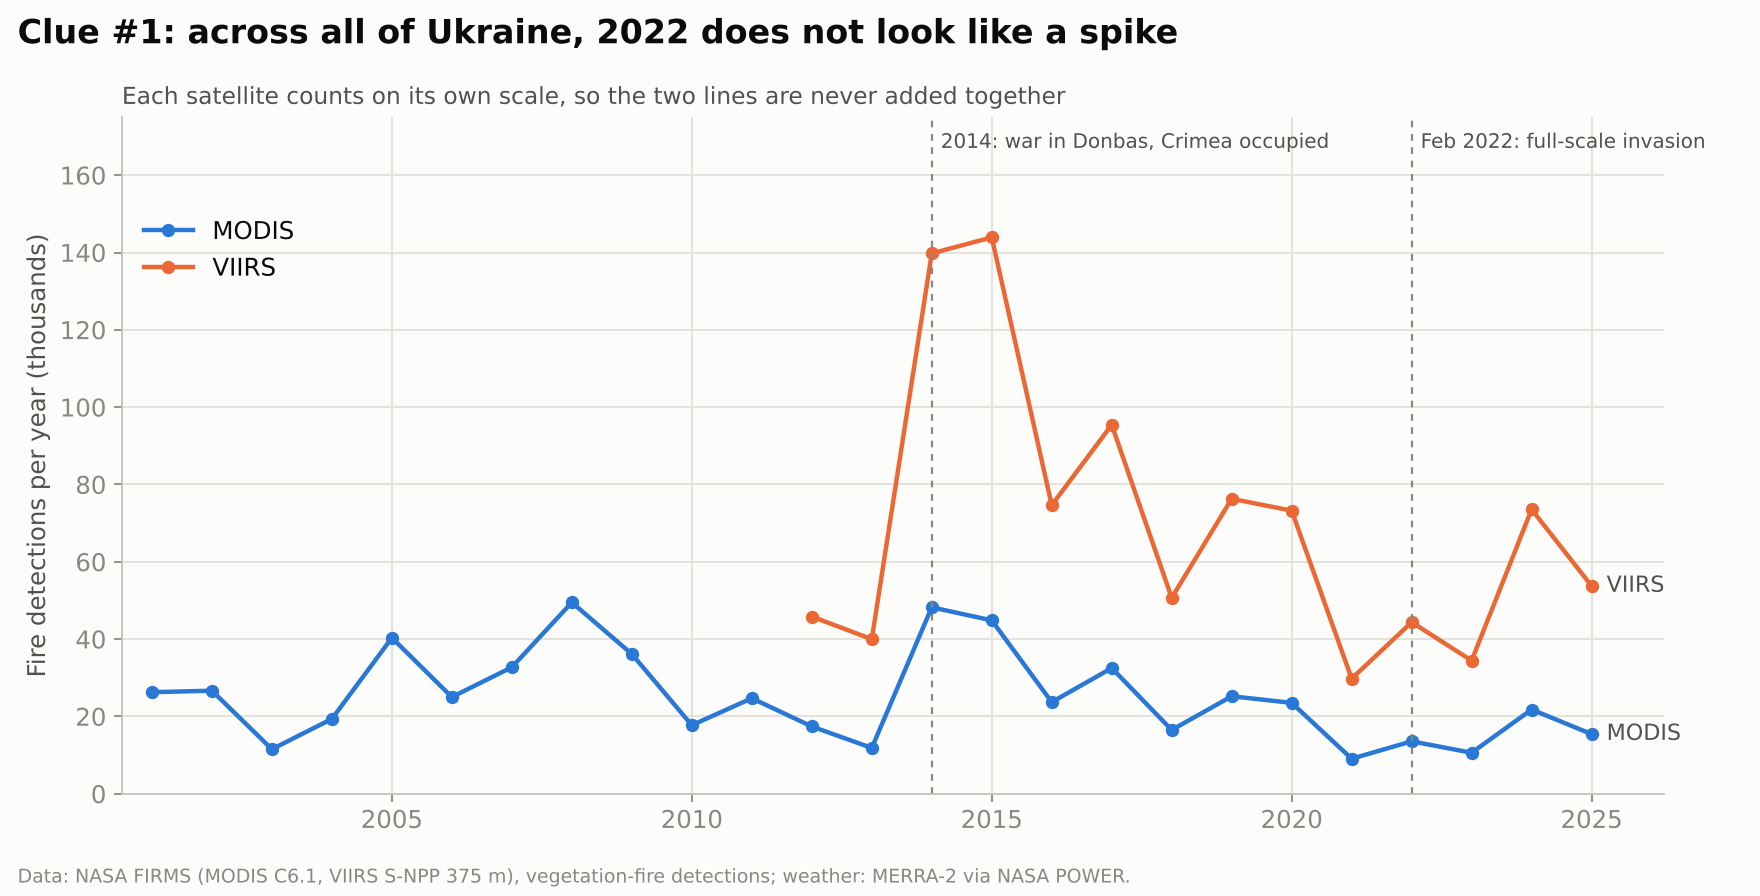
Across all of Ukraine, 2022 does not look like a spike
National totals swing with dry years and farm burning. 2014–2015 were far bigger fire years than anything after 2022. A detective who stopped here would close the case with "nothing changed".

Did the full-scale war change how Ukraine burns? We tested 25 years of NASA satellite fire data, region by region, against what the weather alone would predict.
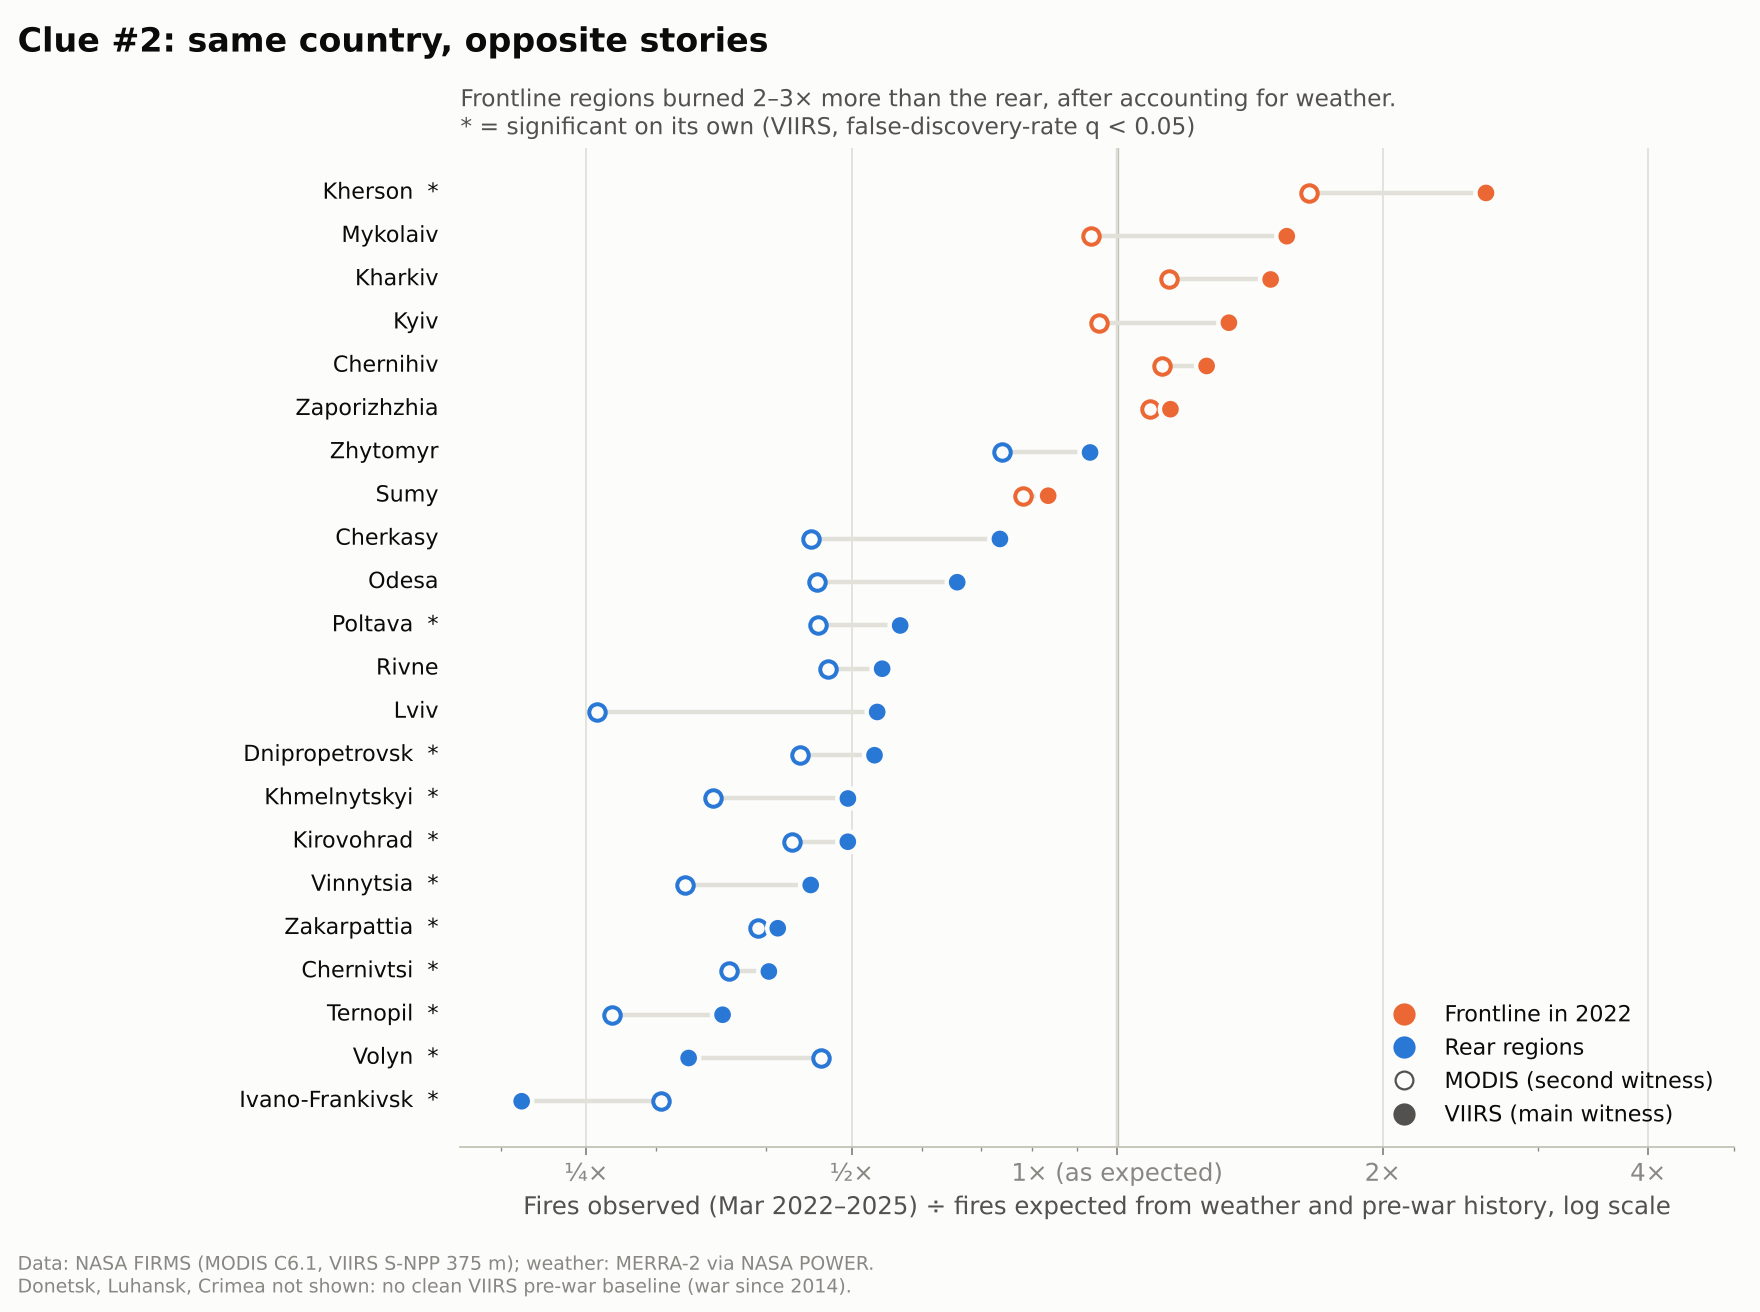
Contrast after removing weather and history. Holds for both satellites and both model versions (p ≤ 0.0003).
VIIRS: 24,544 fire detections observed vs. 12,047 expected (Mar 2022–2025). Significant on both satellites.
Burned significantly less than expected (VIIRS, false-discovery-rate q < 0.05).
Rank agreement between MODIS and VIIRS on which regions changed most (22 regions).
The challenge asks four questions of NASA data: what is changing, where, by how much, and is it significant. We picked one change everybody suspects and few have tested carefully: the war that began in February 2022.
Fires are a good witness. Satellites have counted them several times a day since 2000, in every season. But fires also follow weather, harvests and old habits like burning stubble, so a raw count proves nothing. A real detective has to rule out the alibi first.
Across Ukraine as a whole, no clear change. Region by region, the country split: frontline regions burned 2.2–2.7× more than rear regions after accounting for weather and history.

Fires are the witness.
Weather is the alibi.
Each clue answers one of the challenge's questions: what, where, how much, and is it significant.
National totals swing with dry years and farm burning. 2014–2015 were far bigger fire years than anything after 2022. A detective who stopped here would close the case with "nothing changed".

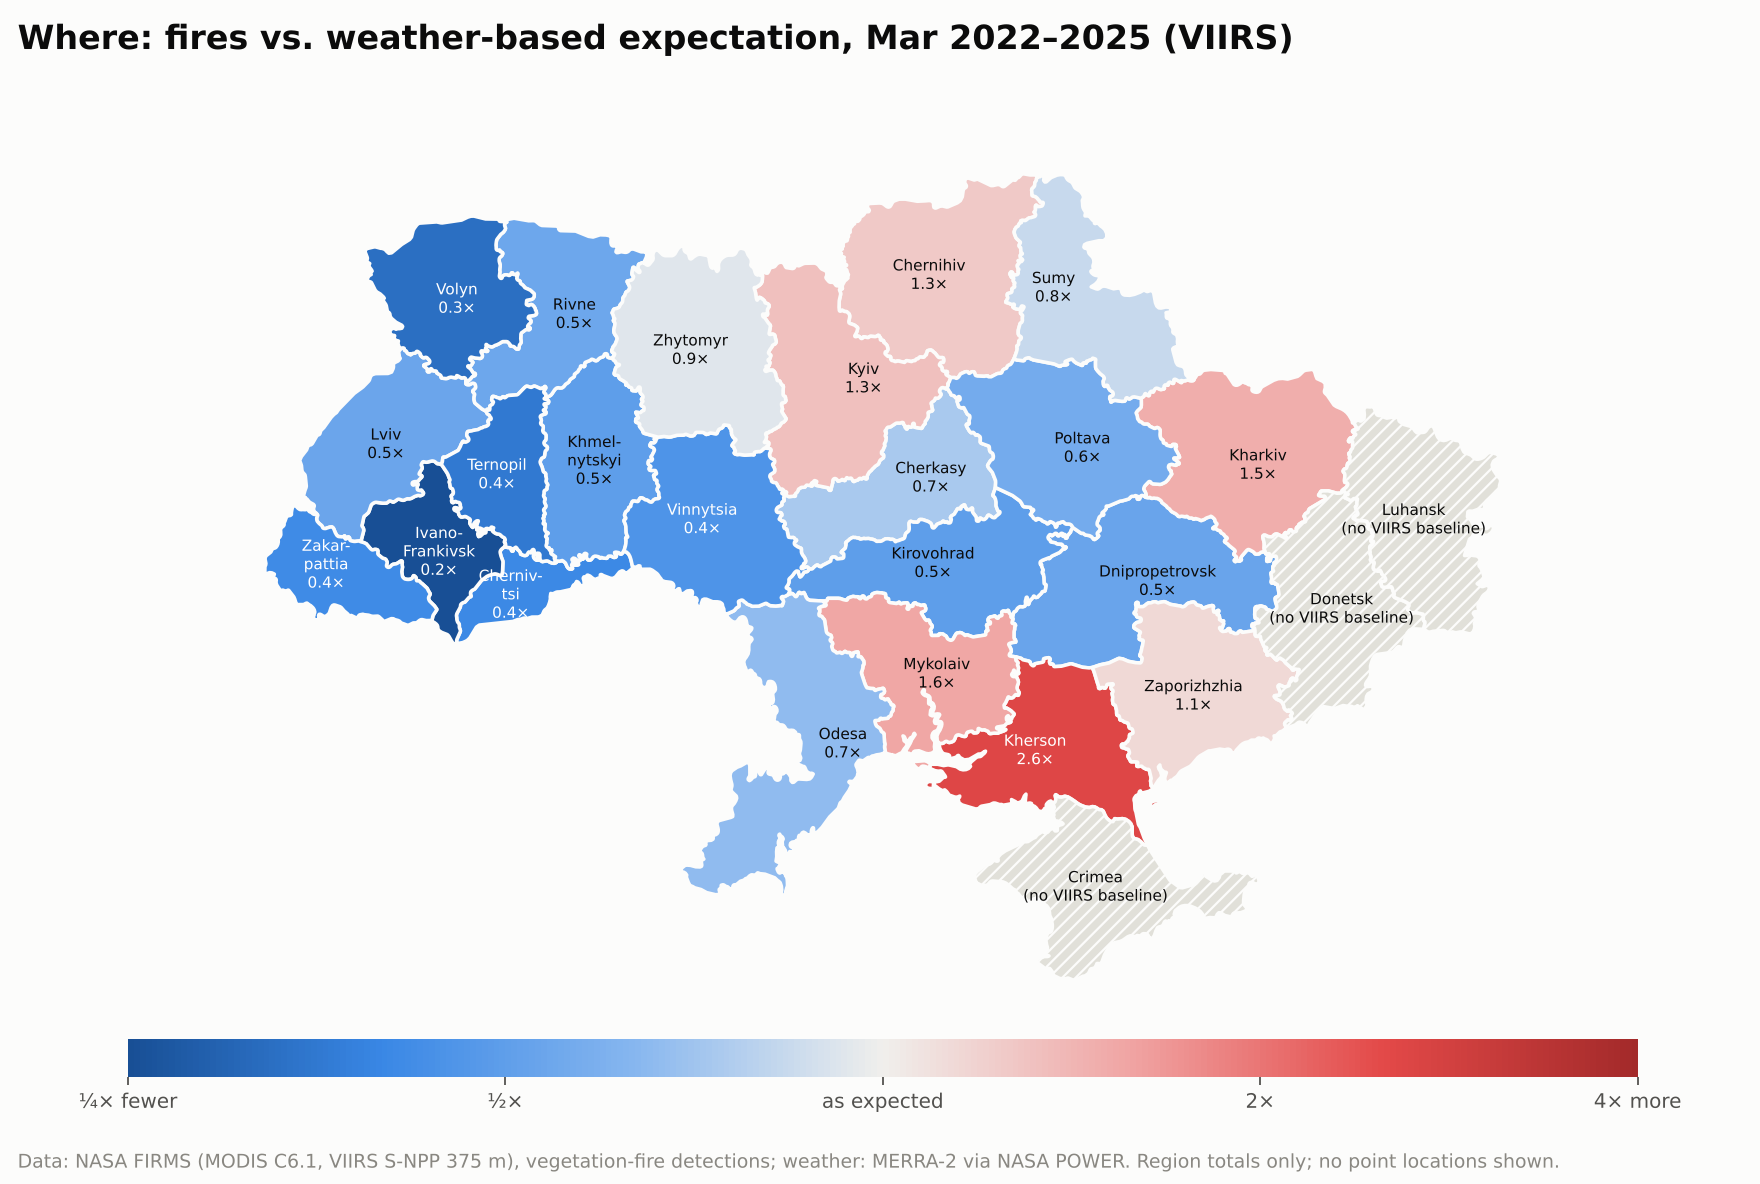
We compared each region with its own expected fire count, built from its pre-war months and that month's weather. Regions with major ground fighting or occupation in 2022 (a list taken from public records, not from the fire data) sit above expectation. Almost every rear region sits below it.


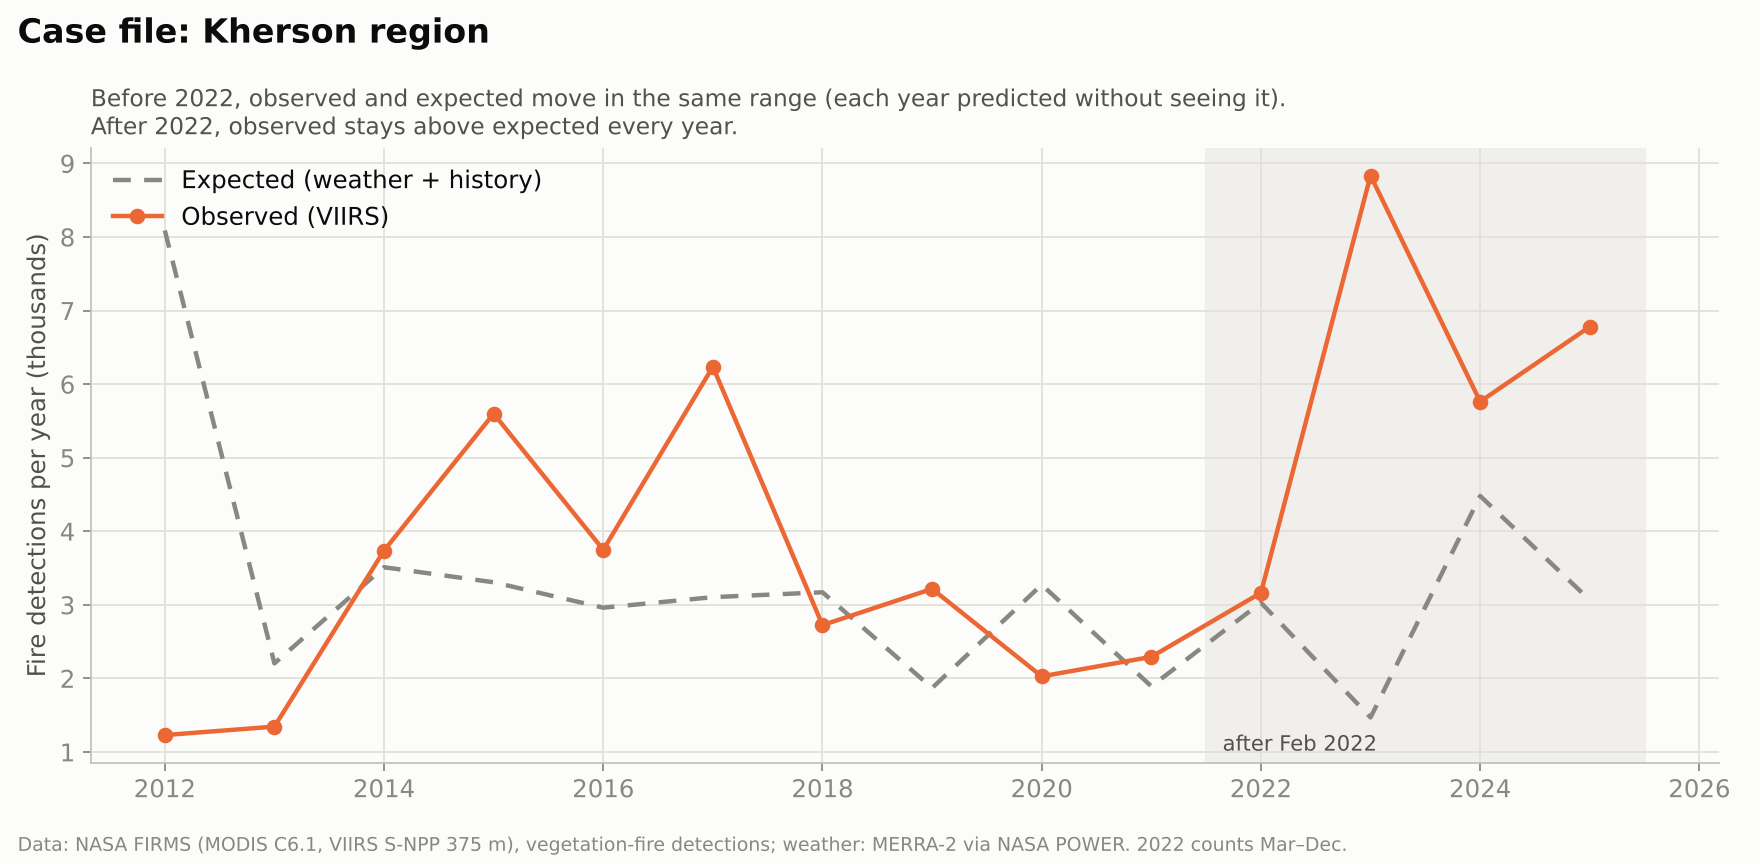
Before 2022, each year was predicted without the model seeing it, and observed fires stayed in the same range as expected. From 2023 on, observed fires run well above expectation every year.

Most trend tools run a Mann-Kendall test, which looks for slow, steady change. Run on Kherson's raw yearly totals, it reports no trend (VIIRS p = 0.06, MODIS p = 0.28). A war is a sudden break, not a slope. So we test the break directly: post-war residuals against pre-war residuals, with a false-discovery-rate correction because we test 25 regions at once.
Some damage lasts seconds; some lasts years. The same detective logic works for both, but each needs a different NASA witness and a different clock.
VIIRS fire detections in Kherson region, Mar 2022–2025, where weather and history predicted 12,047.
Frontline vs. rear contrast in fire energy (summed radiative power), larger than for counts.
Regions tested one by one, each against its own pre-war baseline.
The war's fire signal is spread over hundreds of kilometres and builds month after month. No single day stands out; the pattern only appears when each region is compared with what its own weather and history predict.
NASA FIRMS, the active-fire archive from MODIS (since 2000) and VIIRS (since 2012), plus MERRA-2 weather from NASA POWER to rule out the weather alibi.

Local time of the blast on 4 August 2020: about 2,750 tonnes of ammonium nitrate stored in a port warehouse exploded.
What VIIRS saw at the port about 8.5 hours later (02:35 local, 5 Aug): one fire detection, 2.8 MW, 0.14 km from the blast site.
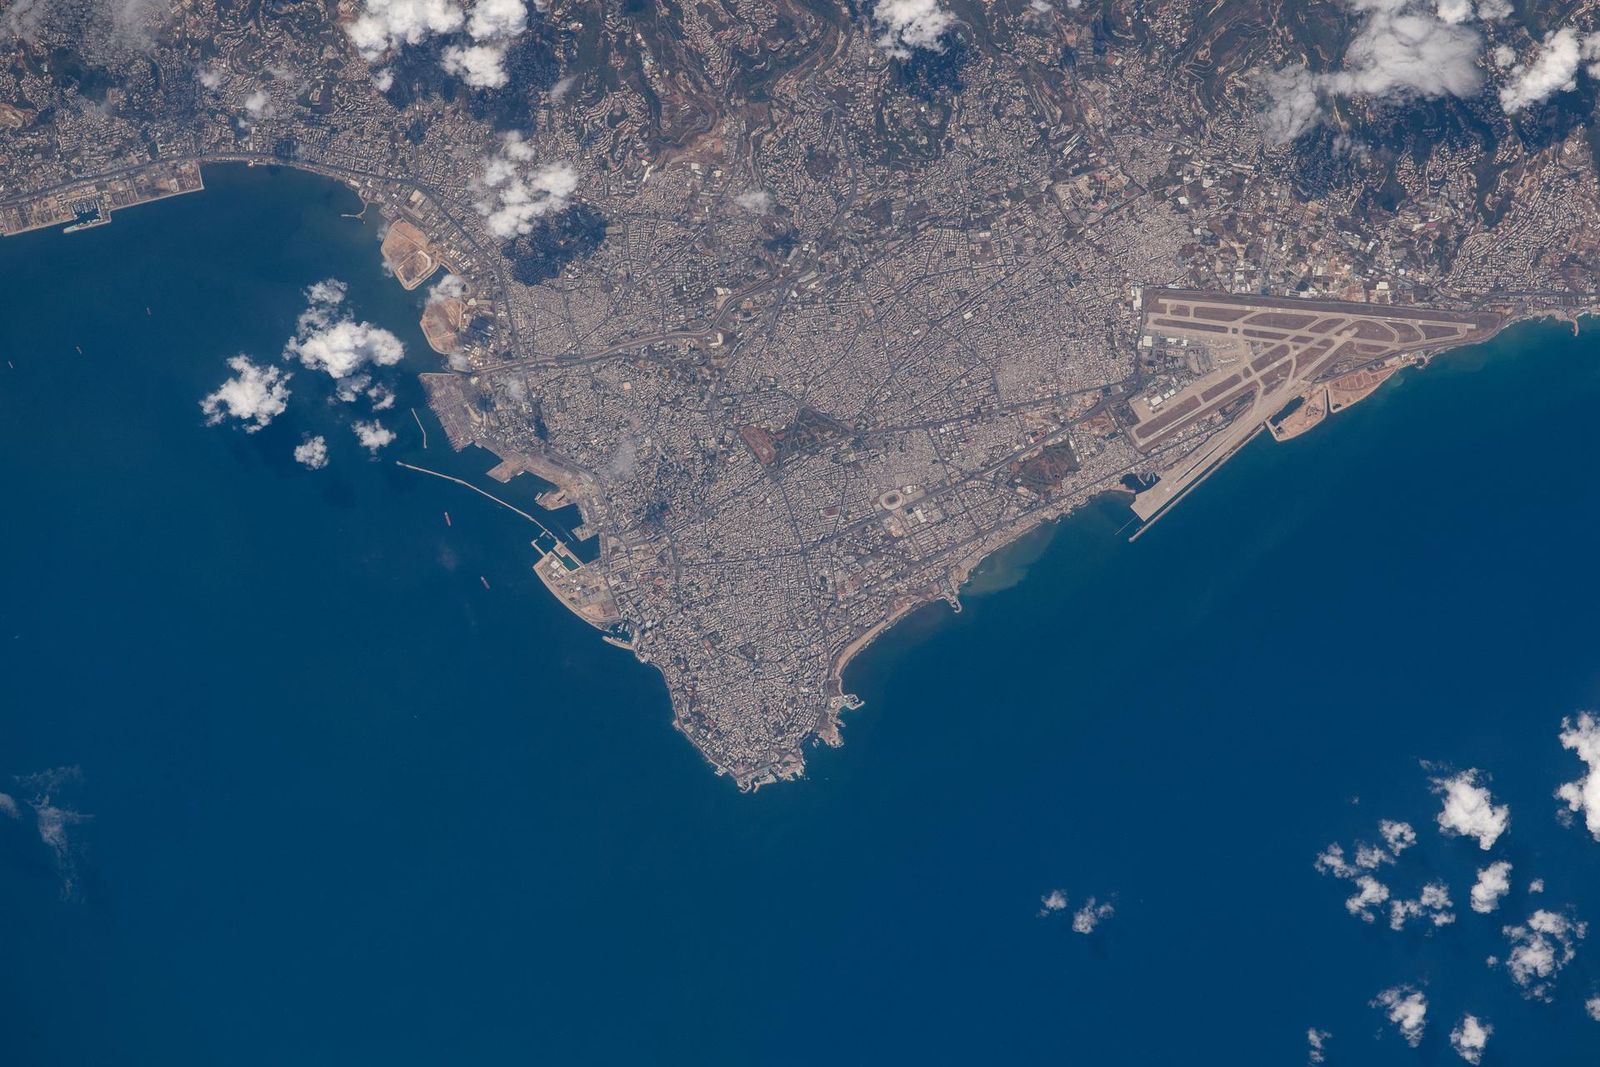
Pixel size of NASA's radar damage map of Beirut, built by the ARIA team from Sentinel-1 data.
The explosion lasted seconds and no fire sensor was overhead. In all of 2020, VIIRS recorded only 2 fire detections within 3 km of the blast site: the one above, and a hotter one (22.7 MW) on 10 September, when a separate fire broke out in a port warehouse of oil and tyres. A fire archive is the wrong witness for a one-second shock.
Beirut was not a war. It was an industrial disaster: the nitrate had been stored unsafely for six years. It is here to show the other end of the time scale.
Radar. NASA's ARIA team and the Earth Observatory of Singapore compared Sentinel-1 radar images from before and after the blast to map likely damage around the port (NASA Earth Observatory, JPL image PIA23692). The blast also sent up an orange-red cloud of nitrogen dioxide, which OMI and TROPOMI can measure: our next step, not yet analysed.
Beirut figures: our query of the NASA FIRMS VIIRS 2020 archive for Lebanon (script and output in Data below). Event facts: International Charter Space and Major Disasters; IChemE Loss Prevention Bulletin 284 (nitrogen dioxide cloud); Al Jazeera (4 Aug 2022): 218 people killed, about 7,000 injured, 300,000 displaced.
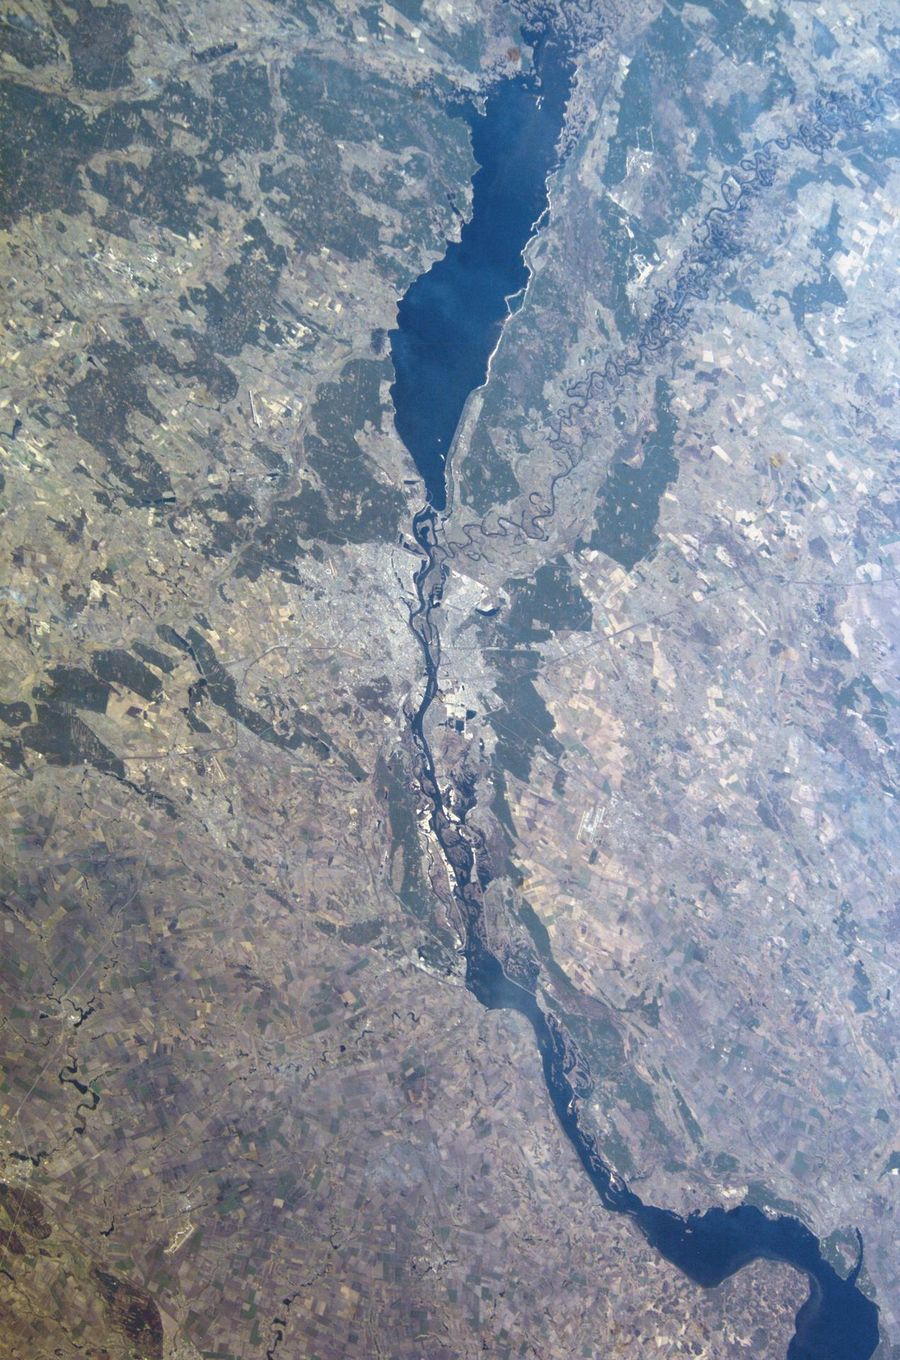
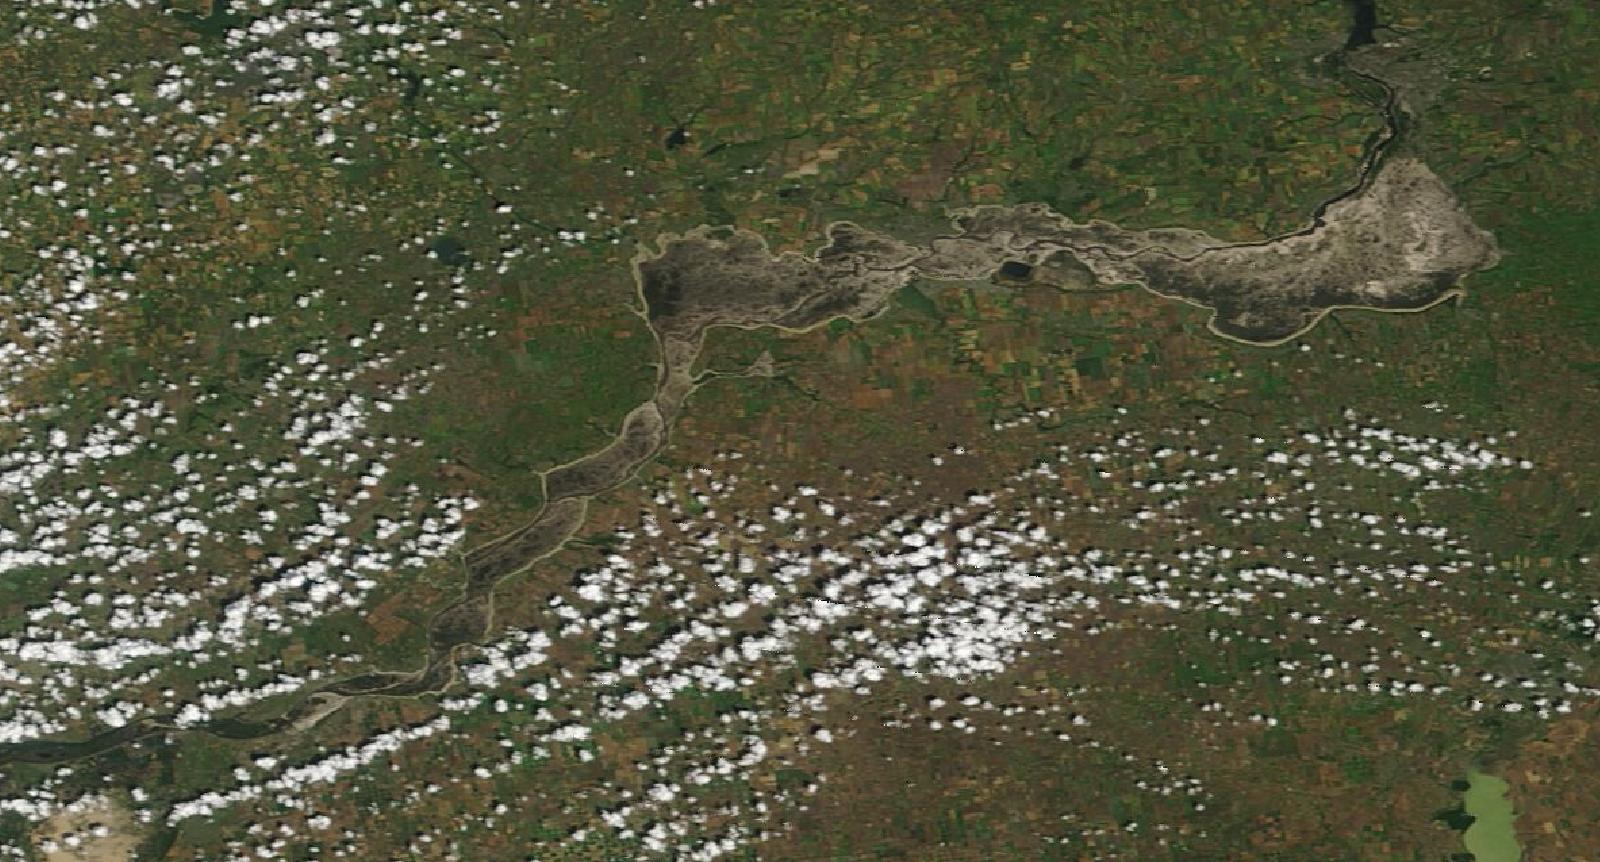
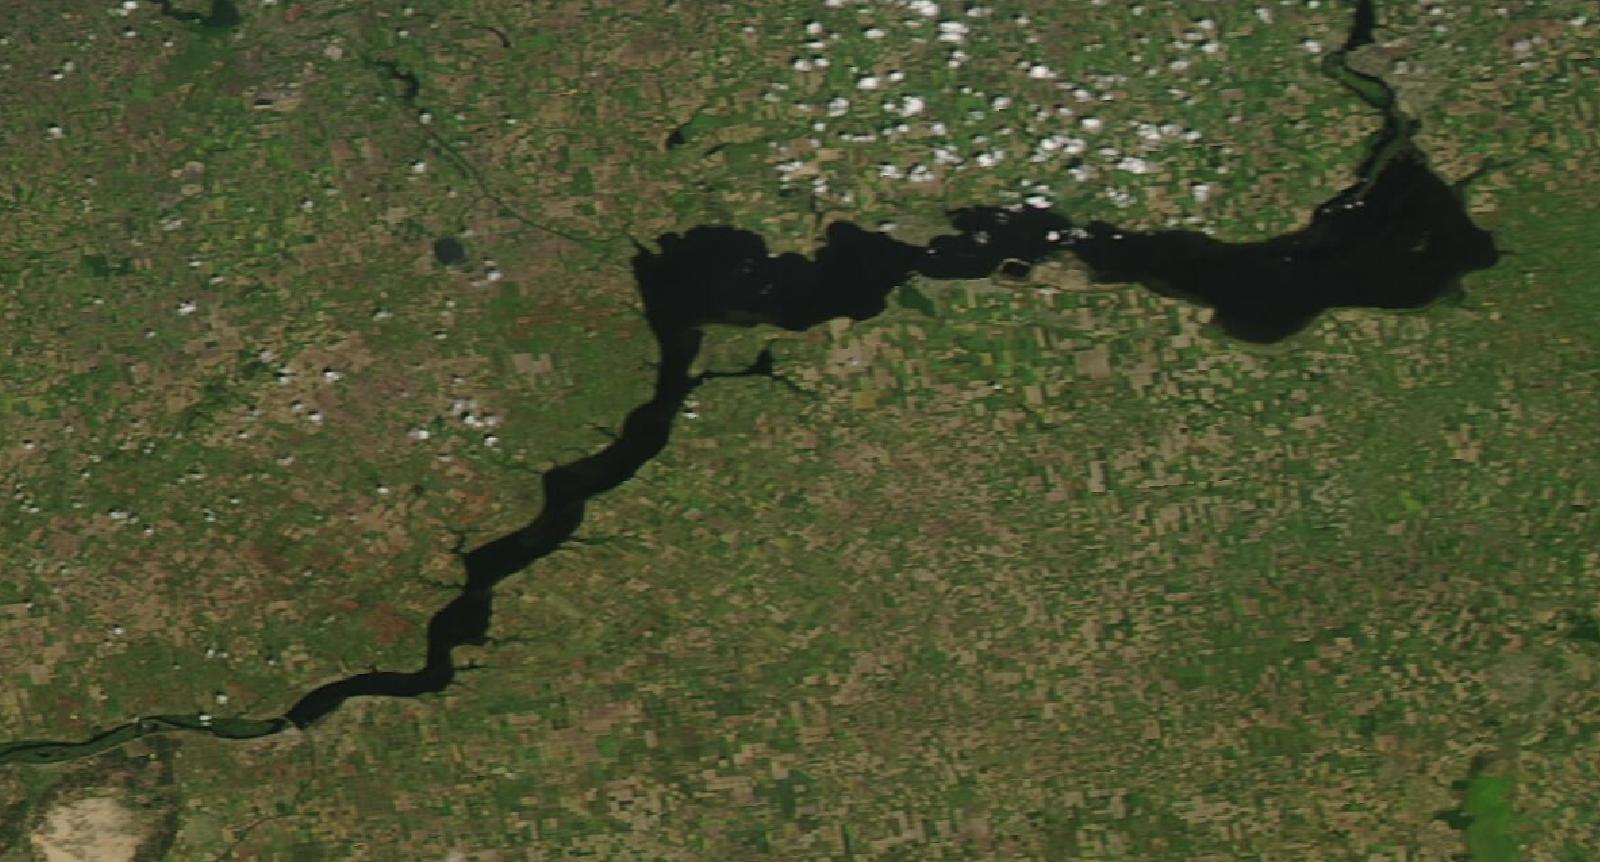
The Kakhovka dam was destroyed on 6 June 2023. Drag the line to compare two NASA true-color images of the same area, 17 days apart. A reservoir about 240 km long drained into mudflats. Yearly averages and slow-trend tests would blur a change like this; it is the kind of break our method is built to catch.
5 Jun 2023 · before22 Jun 2023 · after
NASA MODIS Corrected Reflectance (Aqua, 5 June; Terra, 22 June 2023) via NASA GIBS / Worldview. Area about 46.6–47.9° N, 32.9–35.5° E.
FIRMS also measures each fire's radiative power (FRP, in megawatts): how much heat it gives off when the satellite passes. We ran the same model on the summed FRP per region and month, a fire-energy index.
Frontline–rear contrast for fire energy, up from 2.2–2.7× for counts (both satellites, both model versions, p ≤ 0.0003). Frontline fires were not only more frequent but more intense.
Kherson region: fire energy 4.6 times what weather and history predicted (VIIRS, q = 0.004).
We do not convert this index into tonnes of CO₂. Satellites see each fire only a few times a day, so its duration, the key term in an emissions estimate, is unknown. Specialist groups estimate war-fire emissions with burned-area mapping; our weather-adjusted baseline can help them separate war fires from ordinary ones.
A teaching tool, not our data. You choose the fire's power and how long it burns.
Energy (MJ) = power (MW) × time (s). Dry matter burned = 0.368 kg per MJ of fire radiative energy (Wooster et al., 2005). CO₂ = dry matter × emission factor (approximate values after Andreae, 2019).
Ratio = fires observed ÷ fires expected, March 2022 to December 2025 (a typical-month multiplier). Fire energy uses summed fire radiative power instead of counts. q is the significance after correcting for testing many regions; below 0.05 counts as significant on its own. Tap a column to sort.
Orange: significantly more than expected. Blue: significantly fewer. Donetsk, Luhansk and Crimea: war and occupation since 2014, so their baseline is 2001–2013 and only MODIS covers it.
From pixels to repair.
A fire count on its own changes nothing. It matters when the people who record, claim and repair damage can trust it and check it. This is where our work fits.
War's harm to nature is now formally recorded. Since 30 September 2026 the Register of Damage for Ukraine, set up within the Council of Europe, accepts the State of Ukraine's claims for environmental damage. The Initiative on GHG Accounting of War estimates the climate cost of war fires, and first has to separate them from ordinary fires.
Our part: an open, weather-adjusted baseline for every region that anyone can rerun and check.
Regions that burned far above expectation, such as Kherson, are natural places to start surveying burned steppe, forest and farmland: soil, erosion, replanting, and the safe return of fields to farmers. Regions that burned less than expected may reflect changed farming, which matters for food security.
Our part: a ranked, region-by-region list of where fire changed most, and how sure we are.
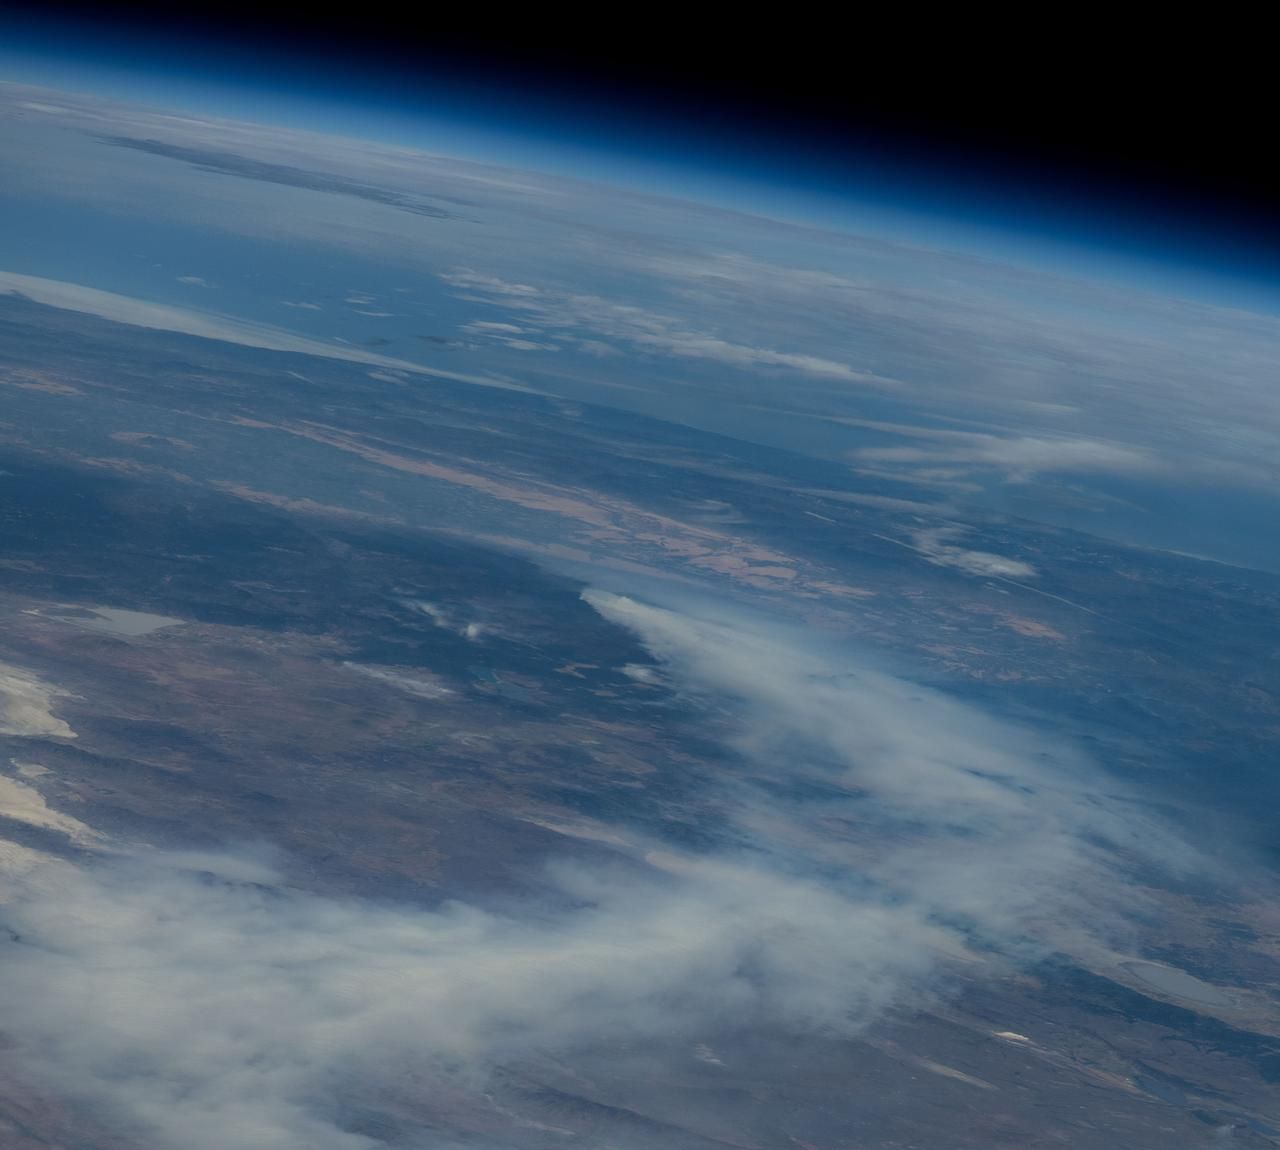
Slow-trend tests miss sudden breaks, as Kherson shows. The same open pipeline works for any shock with a date: a dam failure, an industrial disaster like Beirut, a burning ban, or an extreme wildfire season in Canada.
Our part: code that needs only a region, a date and a NASA archive.
This is one piece of evidence, not a verdict. It does not attribute any single fire, and it is not a legal finding. Our next step after the hackathon: offer the code and results to groups already documenting war's environmental damage, such as CEOBS and the Initiative on GHG Accounting of War, and invite them to test our baseline against their own data.
Sources: Council of Europe and the Office of the President of Ukraine (Register of Damage, 30 September 2026); Initiative on GHG Accounting of War, four-year report (February 2026).
NASA FIRMS standard archives for Ukraine: MODIS Collection 6.1 (2001–2025) and VIIRS S-NPP 375 m (2012–2025). 1.94 million raw detections.
Keep presumed vegetation fires only (FIRMS type 0), dropping static industrial heat sources; MODIS confidence ≥ 30, VIIRS nominal or high. 1.6 million detections remain.
Count detections per region and month, 25 regions within Ukraine's internationally recognised borders. Only these totals leave the pipeline.
Monthly MERRA-2 reanalysis via NASA POWER: maximum temperature, precipitation, humidity and topsoil wetness, averaged over each region and turned into anomalies.
Per region and satellite: log fires ~ month of year + long-term trend + weather anomalies, fitted on pre-war months. Pre-war years are predicted leave-one-year-out, so they are as unseen as the war years.
Welch t-test of post-war vs. pre-war yearly residuals, Benjamini–Hochberg correction across regions, and a frontline-vs-rear Mann–Whitney test with regions as units.
Repeat the model on summed fire radiative power per region and month, a fire-energy index.
Repeat everything without the trend term, and on the second satellite. The frontline-vs-rear contrast survives all four versions; single-region sizes depend on the trend assumption, so we report the contrast as the main finding.
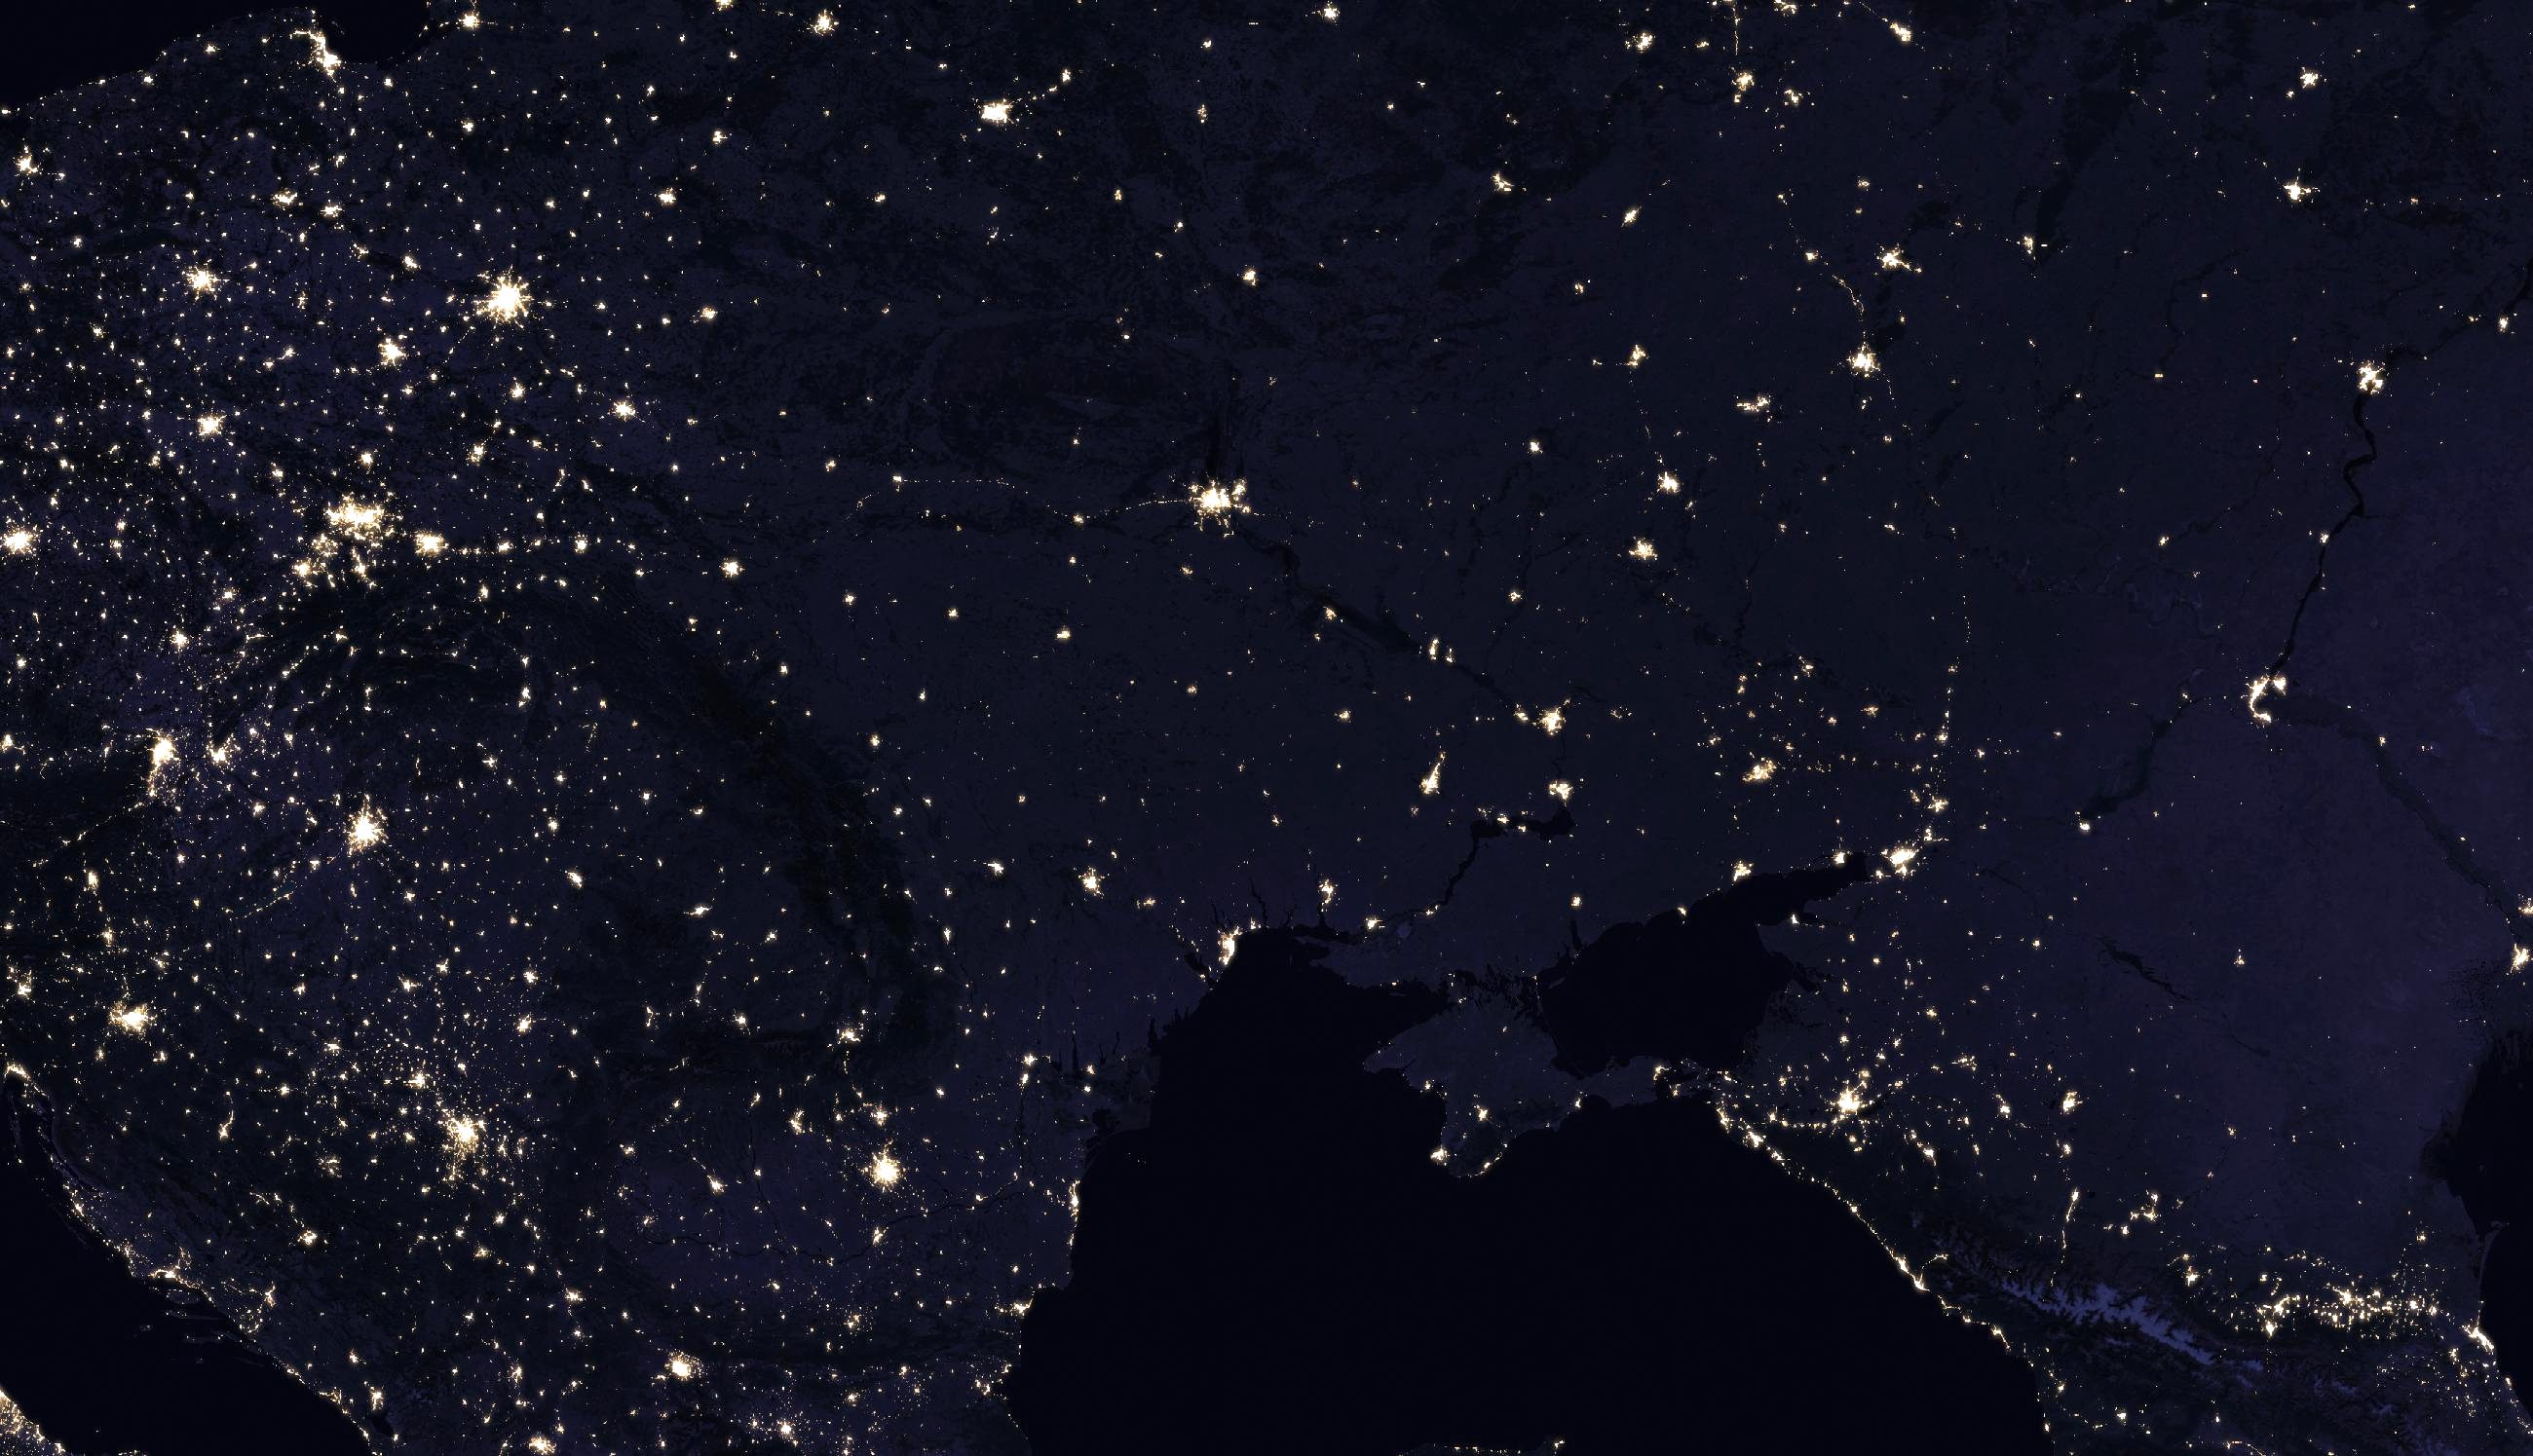
NASA data. FIRMS active-fire archives, MODIS Collection 6.1 and VIIRS S-NPP 375 m (NASA LANCE / FIRMS), for Ukraine 2001–2025 and Lebanon 2020. MERRA-2 reanalysis via the NASA POWER API (T2M_MAX, PRECTOTCORR, RH2M, GWETTOP). MODIS Corrected Reflectance and VIIRS Black Marble imagery via NASA GIBS. Beirut damage mapping cited from NASA JPL's ARIA team.
Other references. Natural Earth 1:10m admin-1 boundaries (public domain), with Crimea and Sevastopol assigned to Ukraine. Python: pandas, geopandas, numpy, scipy, pymannkendall, matplotlib. Fire-energy conversion: Wooster et al. (2005), J. Geophys. Res.; emission factors: Andreae (2019), Atmos. Chem. Phys.
Use of AI. An AI assistant (Claude) helped write the analysis code, charts and this page text, under the team's direction and review. Every number comes from the published scripts run on NASA data; nothing was generated by the AI as data. Every photograph on this page is real NASA imagery; none is AI-generated.
This is an independent hackathon project. It is not endorsed by NASA.